Chris Schepcoff, Environment, Health and Safety, Business Development Manager
EPA 325’s original intent was to regulate oil refineries for benzene concentrations at property fencelines. What followed was individual states and communities getting on board with regulations and consent decrees such as the Colorado State Regulation SB 19-181 and California’s PR 1180 for Refinery Fenceline and Community Air Monitoring. Most oil and petrochemical refineries in the US are now asked to monitor at their facilities. Additionally, mining and construction sites are asked to monitor for particulate matter and shale gas fracking facilities are required to monitor for benzene near neighborhoods and population centers.
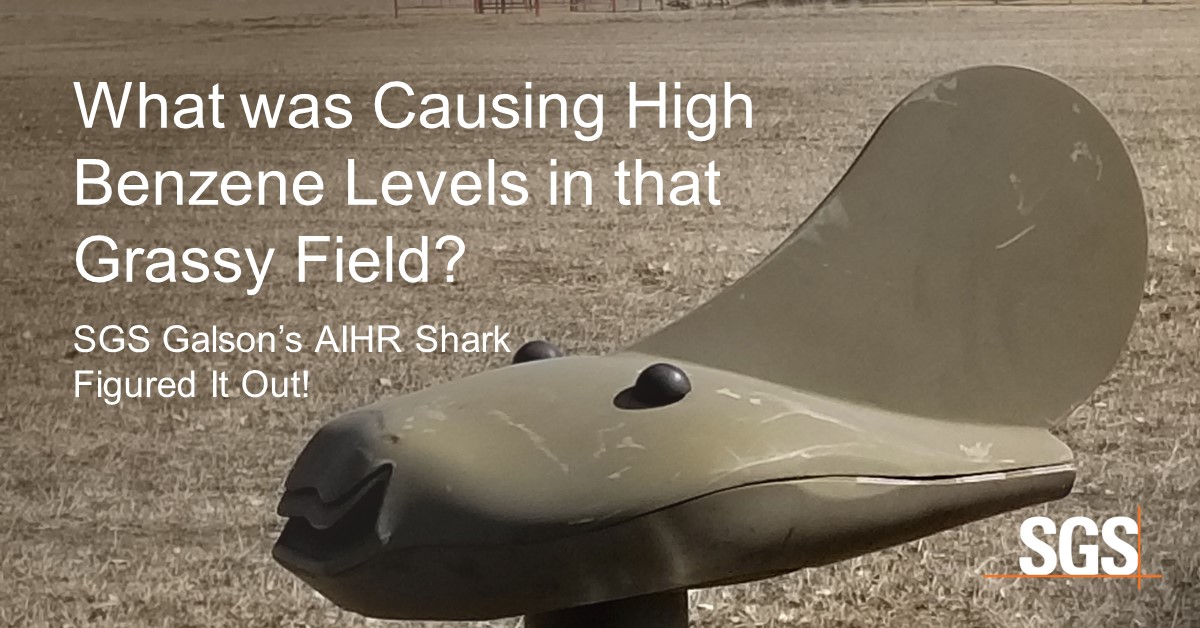
This increase in fenceline monitoring requirements has given SGS Galson the opportunity to innovate, and we have several technologies and solutions that support fenceline and perimeter monitoring investigations. You may identify with the following case study where our client was stumped on where benzene was emanating from. Our passive directional sampler, the AIHR Shark, located the source.
SITUATION
An oil refinery was experiencing elevated TD tube/EPA 325 fenceline monitoring benzene concentrations. EPA 325 requires corrective actions when benzene concentrations exceed the guidance limits. Multiple sources existed in the complex refinery setting and they were unable to determine the emission source based on two-week Windrose data. Windrose data is derived from the wind speed, direction, and duration during the sampling period from an on-site meteorological station or a regional National Oceanic and Atmospheric Administration site (NOAA). After months of exceedances and studying Windrose data, it was still unclear of the source of benzene.
SOLUTION
Four SGS Galson AIHR Sharks, our state-of-the-art hands-free tool that monitors emission levels caused by refinery activity or off-site sources, were initially deployed at the TD tube locations of concern on the fenceline to determine concentration and direction of the emission source. The Sharks were deployed in-line with the two-week sampling period of the TD tubes, then analyzed.
RESULTS
Analyses of the Shark data indicated higher benzene concentrations in certain sample ports related to other ports. The sample results were loaded into a software program which geolocated the Sharks on a Google map of the facility for ease of data interpretation. The results were surprising to the laboratory since the Sharks identified a grassy plot located within the refinery facility. The laboratory works within a complete knowledge vacuum, only interpreting the data, having no knowledge of the facility operations. Upon reviewing the data with the client, it was determined that “it made complete sense”, since the grassy field was the location of the refinery marine vapor flare, unidentifiable to the laboratory from the aerial view of the facility.
CONCLUSION
The data generated from this round of analyses, plus subsequent rounds, provided the empirical data for the facility to determine the combustion efficiency needed to be improved to reduce the benzene concentrations at the fenceline. Unknown to our laboratory, the flare was eventually taken out of service and modified to improve efficiency. Of course, the Shark identified when the flare was taken offline and then confirmed the modifications were sufficient to reduce the benzene emissions.
Contact me with your AIHR Shark questions and for a demonstration; or contact our award-winning Client Services Representatives anytime at:
- Call toll-free or text in real-time at +1 888 432 5227
- Email at ehs.clientcare@sgs.com
- Connect immediately with IHLive chat
 |
Chris Schepcoff
Environment, Health and Safety
Business Development Manager
SGS Galson
Mobile: +1 832 585 9376
Follow me: LinkedIn
|